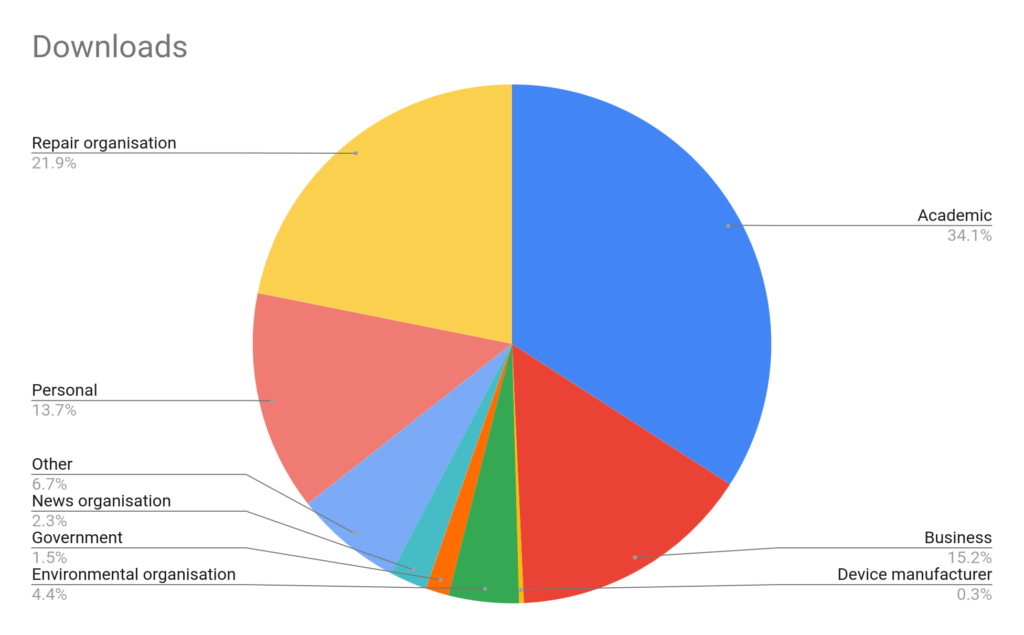
The combined ORDS data has been used and analysed for various purposes – from right to repair policy consultations, to campaigning and activism, to journalism, to individuals simply learning how to do data science on an interesting data set.
Anyone can engage in this analysis – the ORDS datasets are open and downloadable. If you have found something interesting in the data, please get in touch.
Insights by product category
We’ve produced a number of pieces of analysis of the ORA data, which have been fed into right to repair policy consultations.
Other insights and uses of the data
Reports from ORA members
- Analysis of Repair Monitor results (Repair Cafe International)
- How repair can affect CO2 emissions (Repair Cafe International)
- Statistics on repairs (anstiftung)
- The environmental impact of consumer electronics & repair (The Restart Project)
- The environmental impact of repair (The Restart Project)
- A journey into our repair data (The Restart Project)
- Why computers break: what our data shows (The Restart Project)
Reports from other organisations
The ORA data has also been used in reports from other organisations.
- Imaging equipment and its consumables. Preparatory Study for Ecodesign. Assesses the environmental impact of imaging equipment and identifies and evaluates design options with the potential to reduce the impact; also proposes ecodesign measures. A preparatory study by the JRC is the first step in the process through which the EU Commission proposes mandatory legal requirements for products. (European Commission Joint Research Centre, 2024).
- Lifespans and the circular economy. This series of articles examines the potential benefits of lifespan extension across different product groups and explores the technological, economic, social and policy changes which can help realise these benefits here in the UK. (UKRI Circular Economy Hub, 2023).
- Extending the Life of Consumer Electronics. Provides estimates of the benefits of extending the lifespans of three widely used consumer electronics in the UK – smartphones, laptops and tablets. (UKRI Circular Economy Hub, 2023).
- A guide to public data resources for a circular economy modelling & measurement framework. (UKRI Circular Economy Hub, 2023).
- An overview of Europe’s repair sector. Provides an evidence-based update on the status of the repair sector in Europe. (European Environment Agency, 2022).
- Long Live the Machine: How ecodesign & energy labelling can prevent premature obsolescence of laptops (ECOS, 2020).
Other downloads and uses
Since 2020, we’ve had almost 800 downloads of the data by organisations and individuals, for a wide variety of uses.

A small selection of reasons given for downloads:
- “identify fault codes based on fault problem descriptions”
- “Market study of repair and spare parts”
- “Research, articles for print in Danish Magazine and online”
- “National dashboard”
- “To share and promote repair cafes”
- “Repairability Assessments for Appliances and other consumer electronics”
- “A master study research project on the topic of repairability and extending the life cycle of products.”
- “an assignment of the course `design thinking and circular economy`”
- “Personal data science practice!”
What could you use it for?
Data overview
To see all of the overview at a glance, visit the full dashboard.
Tool support for visualisation and analysis
Using tools such as Metabase and Google Data Studio, we can produce statistics and visualisations from the ORDS data. If you’d like to discuss how to use these tools on ORDS data, get in touch. You can of course use the raw data with any tool of your choice.